
SSS device performance benchmarking Part 1
SSS device performance benchmarking Part 1
STEADY STATE THROUGHPUT PERFORMANCE
Introduction to SSS device performance benchmarking
The performance of the Solid State Storage (SSS) device depends critically on:
- Write History and Pre-conditioning: The state of the device prior to the test
- Workload Pattern: Pattern of the I/O (R/W mix, block size, access, etc.)
- Data Pattern: The actual bits in the data payload written to the device
The importance of the SSS device performance measurement is shown in Figure 1. A typical SSS device, taken Fresh-Out-of-the-Box (FOB), and
exposed to a workload,typically experiences a brief period of elevated performance, followed by a transition to Steady State performance.
Figure 1 SSS device performance measurement
(Reference: SNIA Solid State Storage (SSS) Performance Test Specification (PTS) Version 2.0.2)

What are the important SSS device Performance Metrics?
SSS device performance is most often described in terms of three basic metrics:
Input Output Operations per Second (IOPS), Throughput (usually expressed in Megabytes per second or MB/s) and Response Time (or Latency
and typically expressed in milliseconds or microseconds).
- IOPS refers to the IO operation transfer rate of the device or the number of transactions that can occur in a given unit of time
(in this case seconds). The IO transaction rate is measured in IOPS. - Throughput – abbreviated as “TP” and often expressed as Bandwidth – refers to the rate of data transferor, in this case, the amount of data
that is transferring to or from the SSS device Throughput is measured in MB/sec
(and an oft used metaphor is the “water through a fire hose or straw” analogy). - Response Time (or Latency) – abbreviated as “LAT” when shortened from Latency – refers to the time it takes for a command generated by
the host to go to the storage device and return, i.e. the round trip time for an IO request. Response time is measured in milliseconds or
microseconds and is often reported as an Average (AVE) or Maximum (MAX) Response Time.
Factors of Influencing SSS device performance
The performance of an SSS device is highly dependent on its prior usage, the pre-test state ofthe device and test parameters as Figure 2.
Figure 2 Factors of influencing SSS device performance

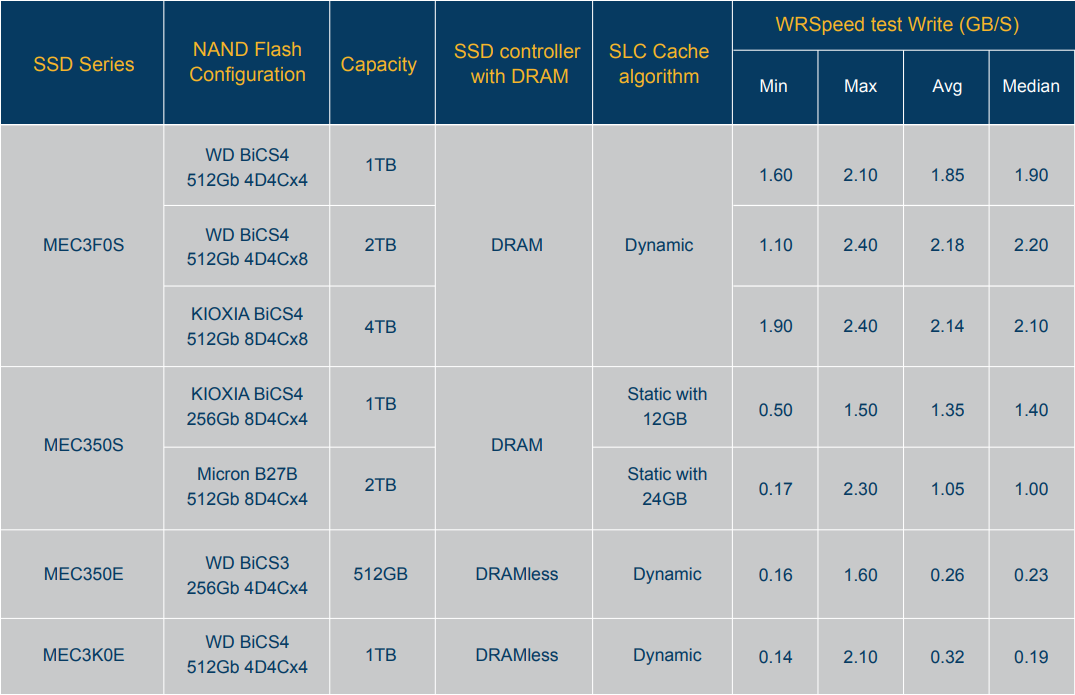
Throughput performance test for Silicon Power Industrial SSD
Silicon Power Industrial follows industrial standard and performance test specifications to verify SSS device performance. However Industrial
application varies from different industries, Silicon Power Industrial team provides verification services to apply customers’ data pattern and workload
to simulate real world performance.
Used case 1: Steady state write throughput performance evaluation with continuous write pattern until full disk
Silicon Power Industrial develops test script “ WRspeed ” to write data size 4MB and calculate write performance on every 1GB data written with ext4
format partition under Linux to propose the best model to customer’s requirements.


Used case 2: Steady state write performance evaluation with repeated file written and erase
Silicon Power Industrial develops test script code based on Linux command “dd” to write data size 4MB for 1000 cycles, Total file size is 4GB. The
test script code will confirm data in the system cache is written to the SSD successfully. The behavior of “dd” is to write RAW data without any
partition. Then repeated 1000 loops to overwrite the 4GB file.


Used case 3: Write 5.53MB every 16.6ms to a 512GB CFexpress card and continue sequential write without secure erase and no frame drop. ie. Steady state write
Throughput performance should be about 333MB/s
Silicon Power Industrial develops test script WRspeed to Write Data size 4M and calculate write performance on every 1GB data written with iMac
macOS and Ubuntu 20.04. Steady State write performance is above 333MB/s.